GenomeStudio Software
Introduction to GenomeStudio Software
Visualize and analyze data generated on Illumina array platforms with GenomeStudio Software. This powerful solution supports the genotyping analysis of microarray data. Performance-optimized tools and a user-friendly graphical interface enable you to convert data into meaningful results quickly and easily.
GenomeStudio Software Modules
Genotyping Module
- Analyze SNP and CNV data across 5 million markers and probes
- Detect sample outliers
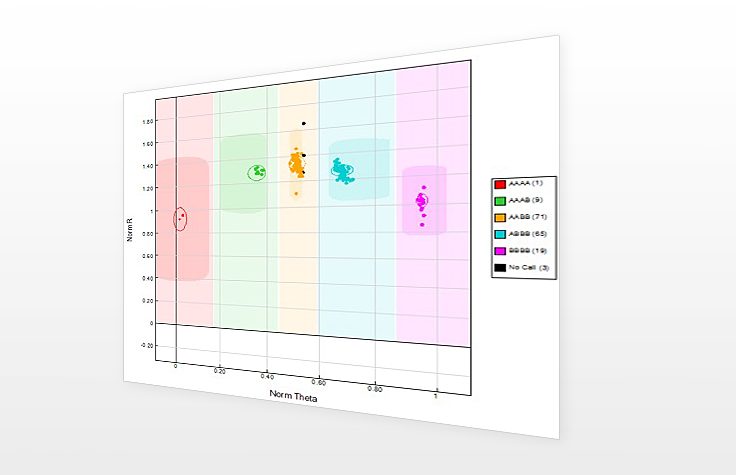
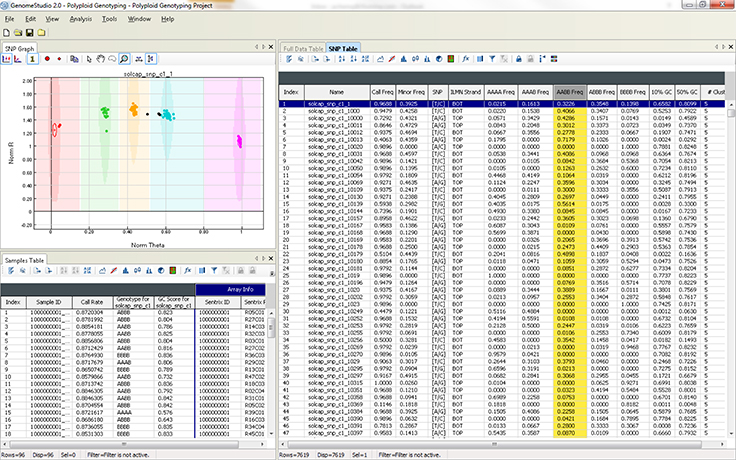
The graphical display of genotypes in GenomeStudio is a Genoplot, with data points color coded for the call (red = AA, purple = AB, blue = BB). Genotypes are called for each sample (dot) by their signal intensity (norm R) and Allele Frequency (Norm Theta) relative to canonical cluster positions (dark shading) for a given SNP marker.
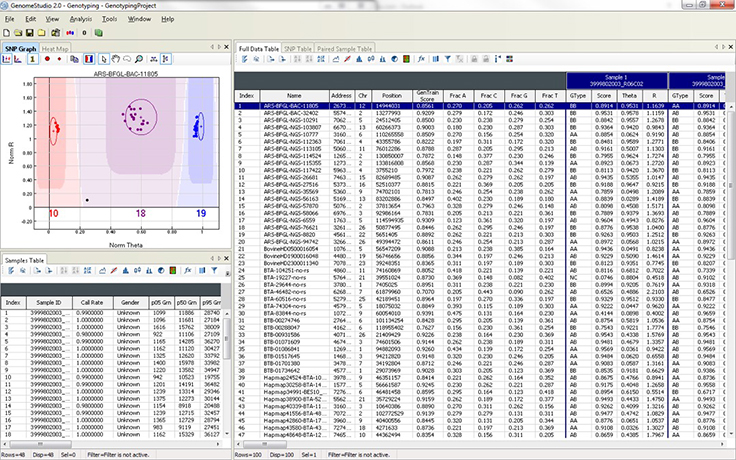
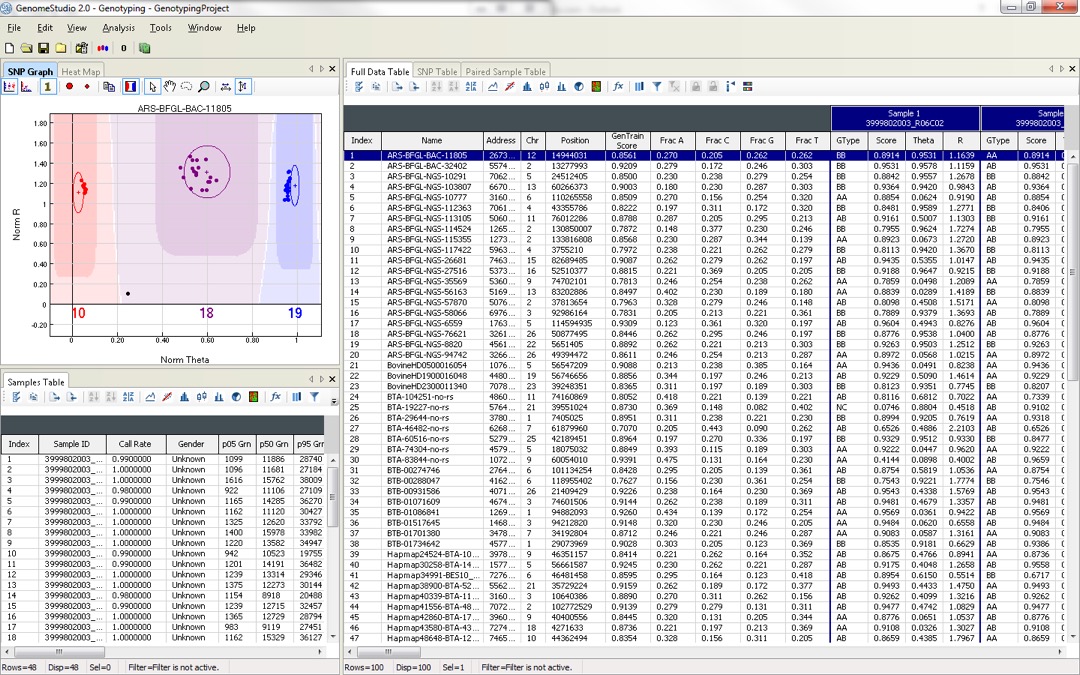
The GenomeStudio Genotyping (GT) Module supports the analysis of Infinium and GoldenGate genotyping array data. This module enables efficient genotyping data normalization, genotype calling, clustering, data intensity analysis, loss of heterozygosity (LOH) calculation, and copy number variation (CNV) analysis. Fully integrated with the Infinium LIMS server, the GT Module allows you to access data and manage projects directly from within GenomeStudio.
As in all GenomeStudio modules, the GenomeStudio Framework displays data output in tabular form and enables you to visualize your results quickly and easily using the Illumina Genome Viewer and Illumina Chromosome Browser graphical tools.
GT Module Highlights
- Analyze SNP and CNV data across 5 million markers
- Estimate Log R ratio and B-allele frequency for copy number analysis
- Call genotypes, normalize and cluster data, and generate SNP statistics
- Export genotype data to various third party applications; access multiple CNV algorithms and copy number variation analysis tools
- Generate a chromosomal heat map for examining copy number aberrations across the entire genome for multiple samples
- Analyze data from two different product versions within the same project
Gene Expression Module
- Analyze differentially expressed genes across different genomes
- Profile miRNA expression
- Combine mRNA and microRNA data in a single project
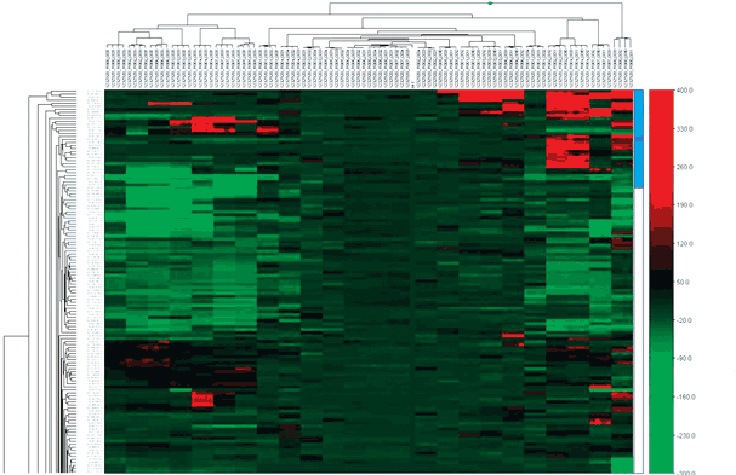
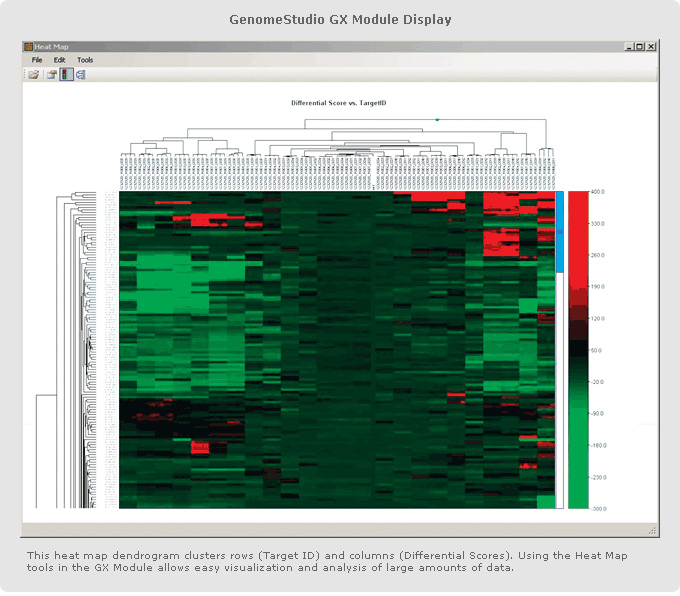
This GenomeStudio heat map dendrogram clusters rows (Target ID) and columns (Differential Scores). Using the Heat Map tools in the GenomeStudio Gene Expression Module enables easy visualization and analysis of large amounts of data.
The GenomeStudio Gene Expression (GX) Module supports the analysis of Direct Hyb and DASL expression array data. It enables the visualization of differential mRNA and microRNA expression analysis as line plots, histograms, dendrograms, box plots, heat maps, scatter plots, samples tables, and gene clustering diagrams. Simplified data management tools in GenomeStudio Software include hierarchical organization of samples, groups, group sets, and all associated project analysis.
As in all GenomeStudio modules, the GenomeStudio Framework displays data output in tabular form and enables you to visualize your results quickly and easily using the Illumina Genome Viewer and Illumina Chromosome Browser graphical tools.
GX Module Highlights
- Analyze differential expression using gene-level statistical analysis tools
- Visualize results as line plots, histograms, dendrograms, box plots, heat maps, scatter plots, samples tables, and gene clustering diagrams
- Simplify data management for hierarchical organization of samples, groups, group sets, and project analysis
- Identify fold-level changes, perform T-test and ANOVA, and compare results across different sample group sets
- Combine and merge gene expression data with DNA methylation and miRNA profiling data within the same project
- Export whole-genome expression and genotyping data to various third party tools for eQTL analysis
Methylation Module
- Detect cytosine methylation at single-base resolution
- Identify methylation signatures across the entire genome
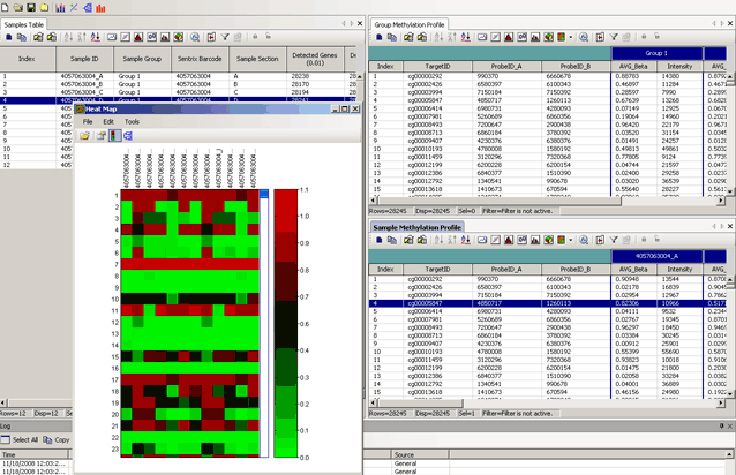
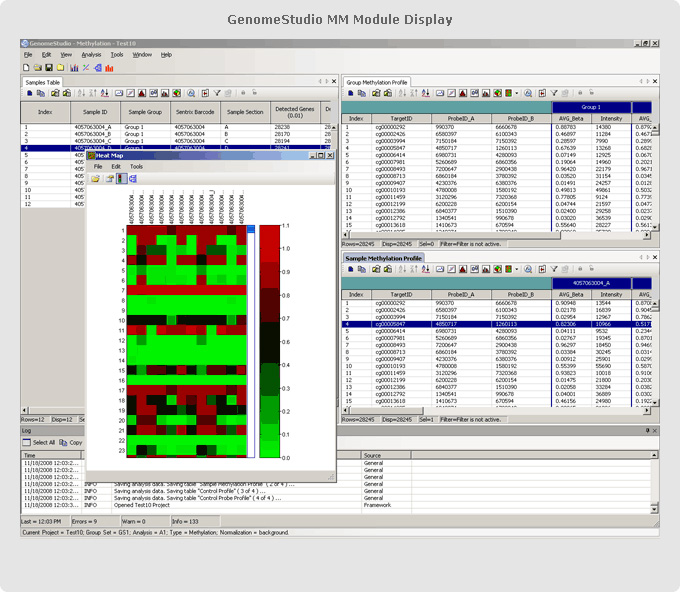
The GenomeStudio Methylation (M) module supports the analysis of Infinium and GoldenGate methylation array data. This module calculates methylation levels (beta values) and analyzes differential methylation levels between experimental groups. It enables you to view CpG island methylation status across the genome with the llumina Genome Browser and Illumina Chromosome Browser.
Single-site resolution data can be visualized as line plots, bar graphs, scatter plots, histograms, dendrograms, box plots, or heat maps. This module also enables you to combine methylation data with gene expression profiling experiments within the same GenomeStudio project for correlation between levels of methylated sites (beta values) and differential gene expression levels (p values).
Methylation Module Highlights
- Calculate methylation levels and visualize CpG island information
- Analyze differential methylation levels between two experimental groups
- Visualize results as line plots, bar graphs, scatter plots, histograms, dendrograms, box plots, heat maps, or control summary reports
- Merge gene expression profiling data with methylation data in the same project
- Display whole-genome data and beta values within the Illumina Genome Viewer
- Visualize beta values for one or more samples in the Illumina Chromosome Browser
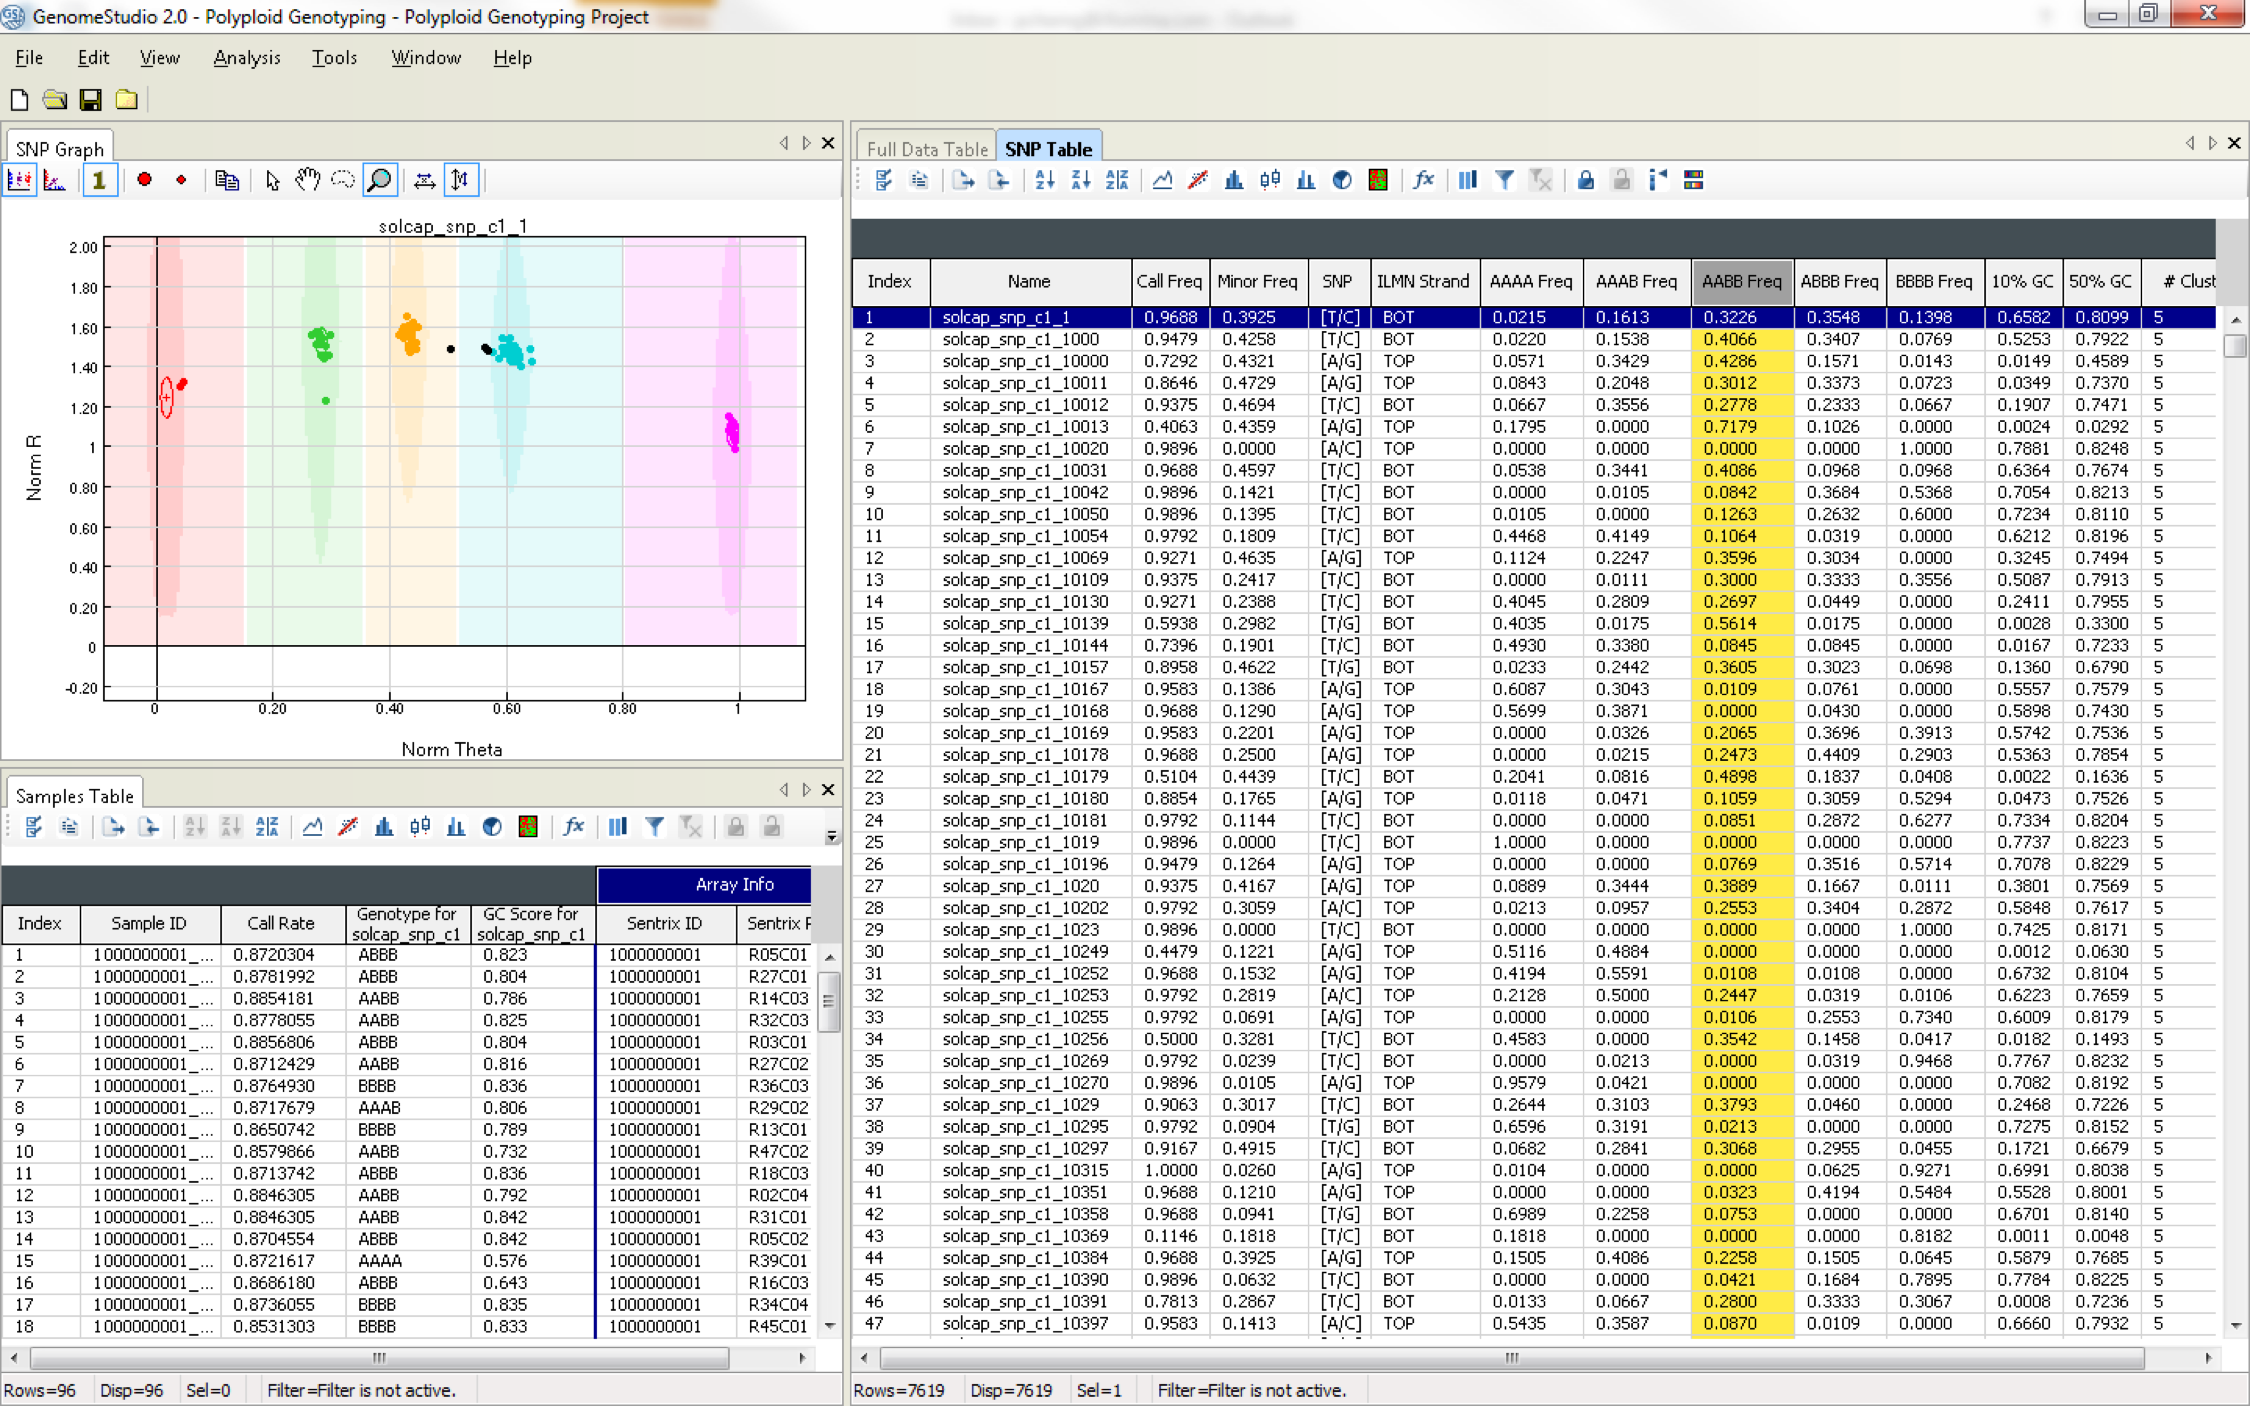
Polyploid Genotyping Module
- Analyze polyploid organism genotyping data
The Polyploid Genotyping Module supports genotyping data analysis of polyploid organisms such as wheat and potato. It uses two density clustering algorithms to assign samples to meaningful clusters: PolyGentrain and Density Based Spatial Clustering of Applications with Noise (DBSCAN).
Polyploid Genotyping Module Highlights
- Call as many clusters as desired, enabling studies of hexaploid or octoploid species
- Automate clustering and genotyping calling for polyploid organisms
Access to GenomeStudio Software
Access to GenomeStudio 2.0 is now free. Start using GenomeStudio 2.0.
Interested in receiving newsletters, case studies, and information on genomic analysis techniques? Enter your email address.
Additional Resources
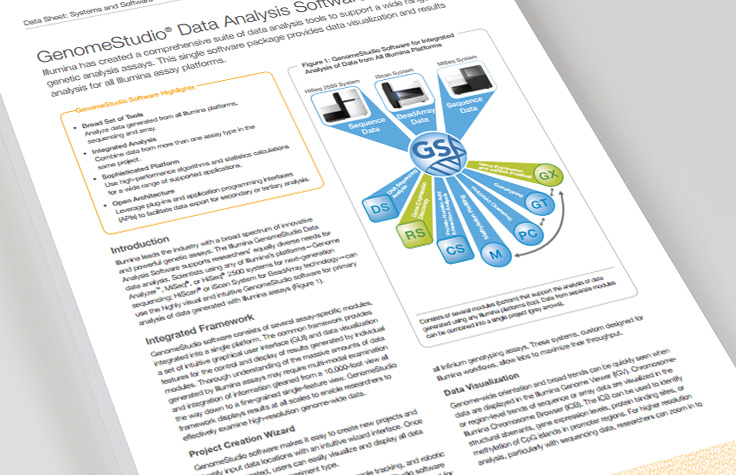
GenomeStudio Software Data Sheet
See how GenomeStudio provides data visualization and results analysis for a wide range of genetic analysis assays.
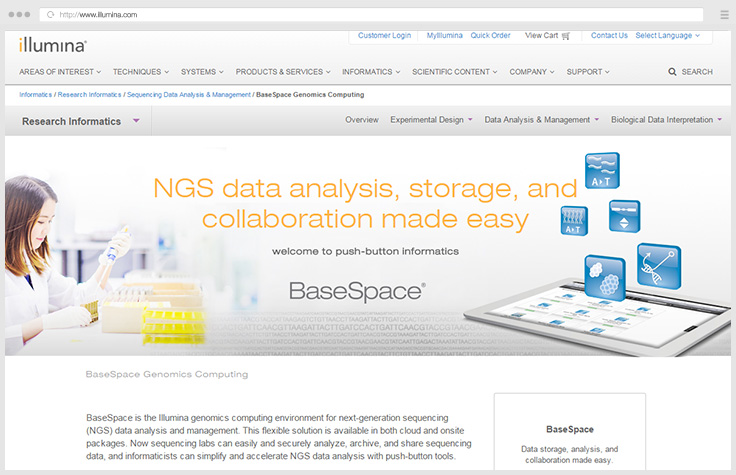
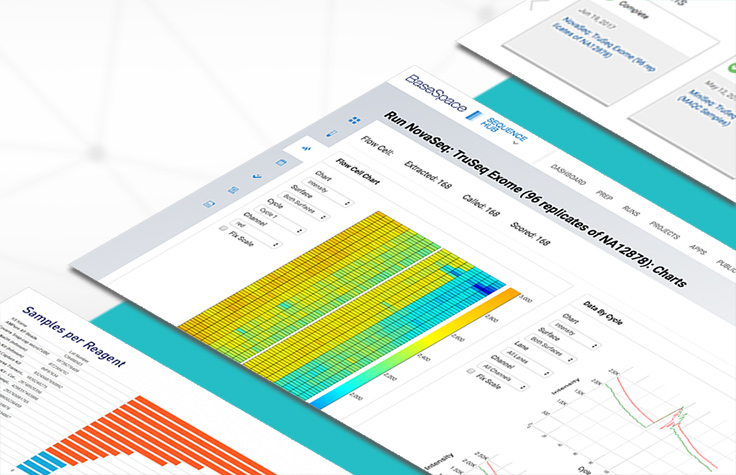
Push-Button Informatics
BaseSpace Sequence Hub makes NGS data analysis accessible to any researcher, regardless of bioinformatics experience.
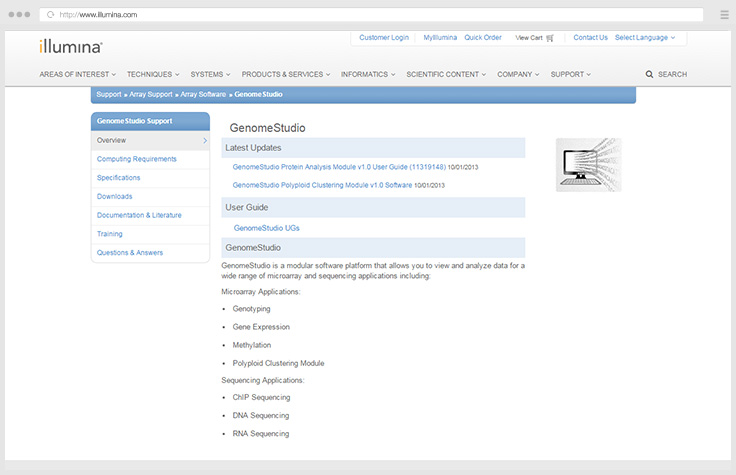
GenomeStudio Support
Find user guides, computing requirements, FAQs, and additional technical information.
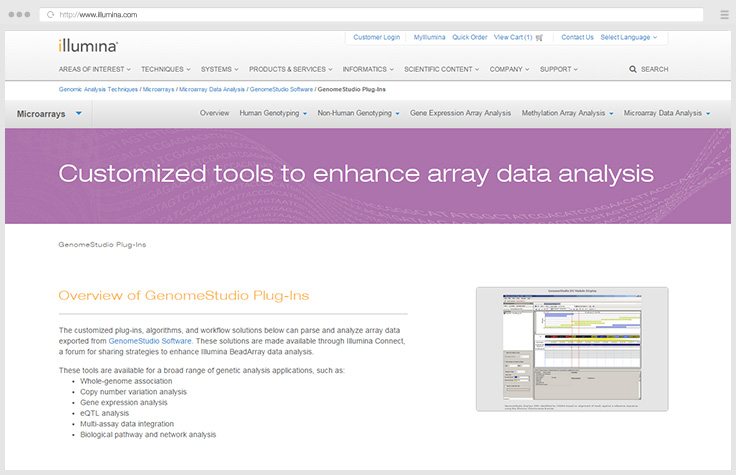
GenomeStudio Plug-Ins
Access customized plug-ins and algorithms that can parse and analyze array data exported from GenomeStudio.
Data Analysis and Management Tools
Our bioinformatics tools for NGS and microarray technologies help transform complex genomic data into insights.
Genotype clustering
GenTrain 3.0 enables accurate genotyping with improved sample intensity normalization and data clustering