What's new in MyIllumina
Unified online business in a single platform
Unified online business in a single platform

Receive advance notification about discontinued products, along with suggested replacement options that you can easily add, swap, or replace with a single click directly from the notification. Access these notifications from the product finder widget on the MyIllumina dashboard, quick cart, cart page, or product page—wherever you prefer to manage your cart.


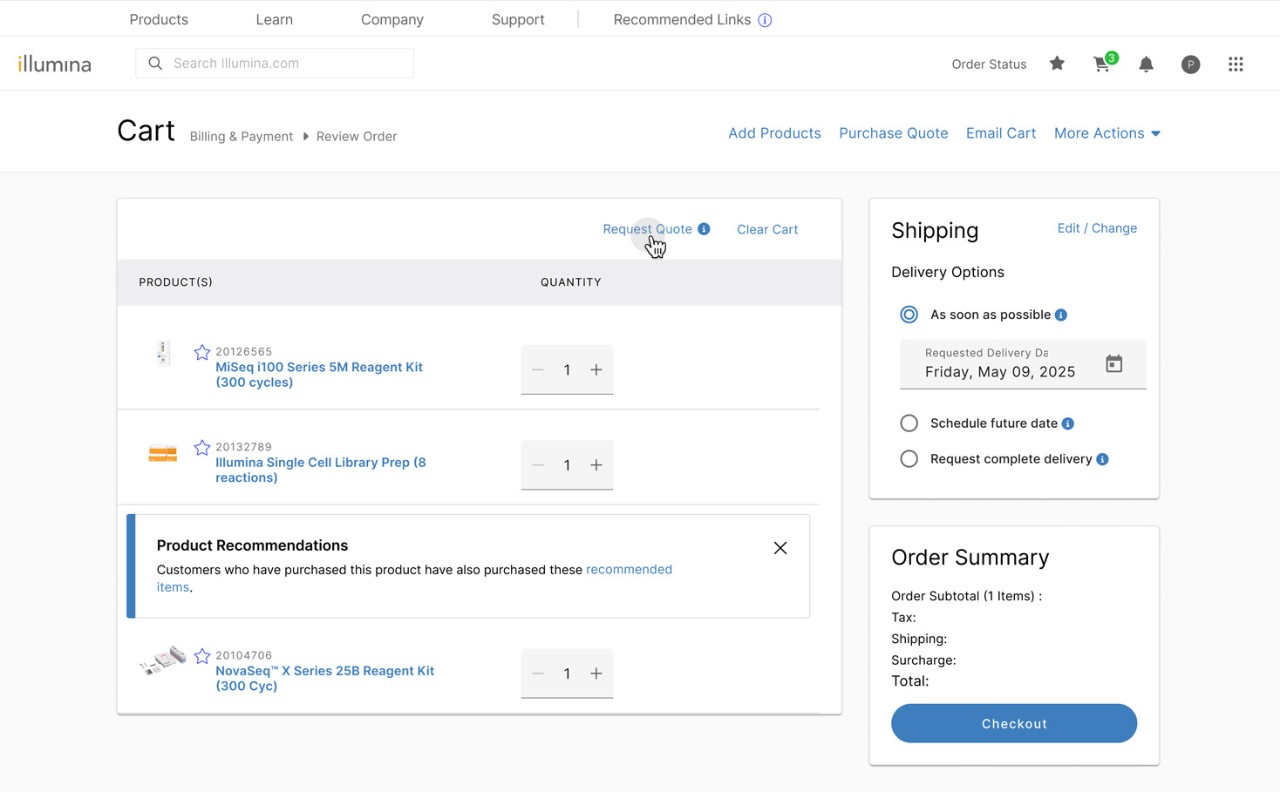
After adding products to your cart, you can now request a quote directly from the cart by clicking the new “Request Quote” link at the top, making it fast and simple to submit quote requests online anytime.


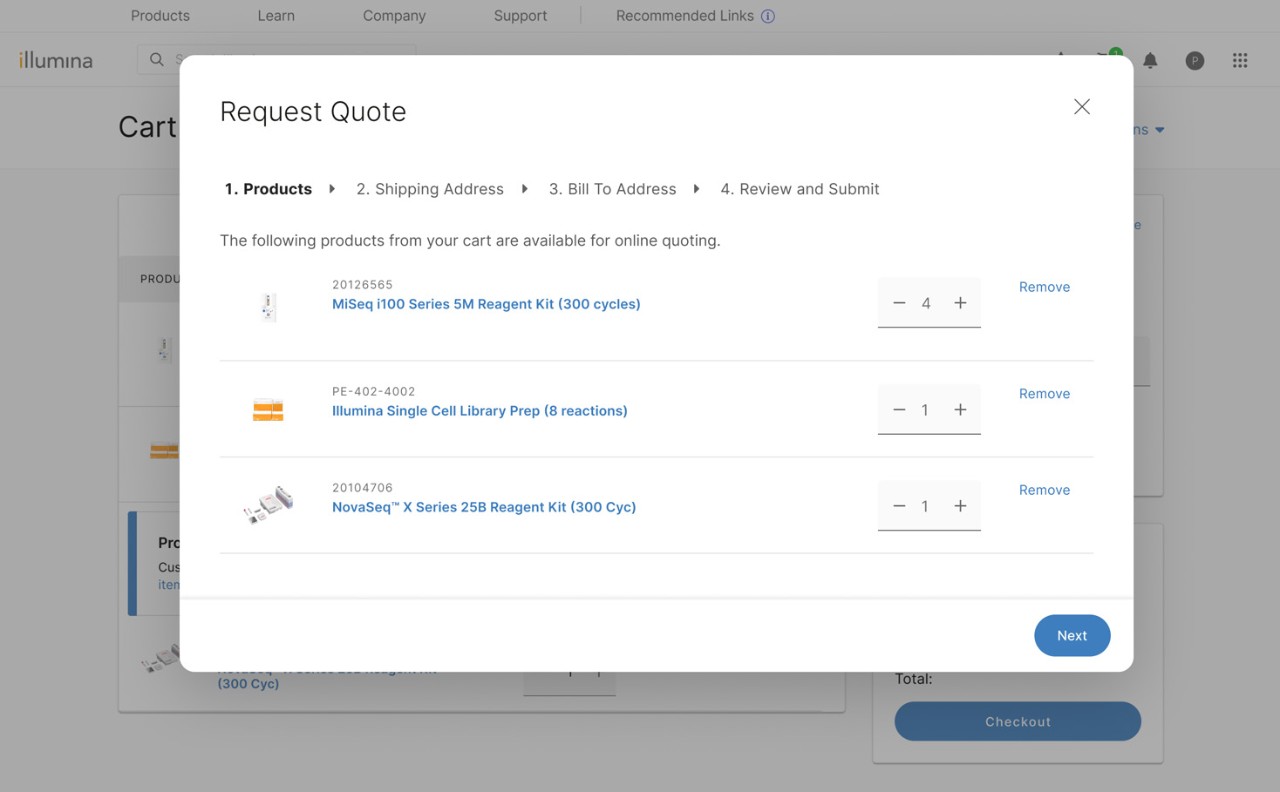
After clicking request quote, the guided process will allow you to refine quantities, select a shipping address, billing address, and review your quote request before submitting.


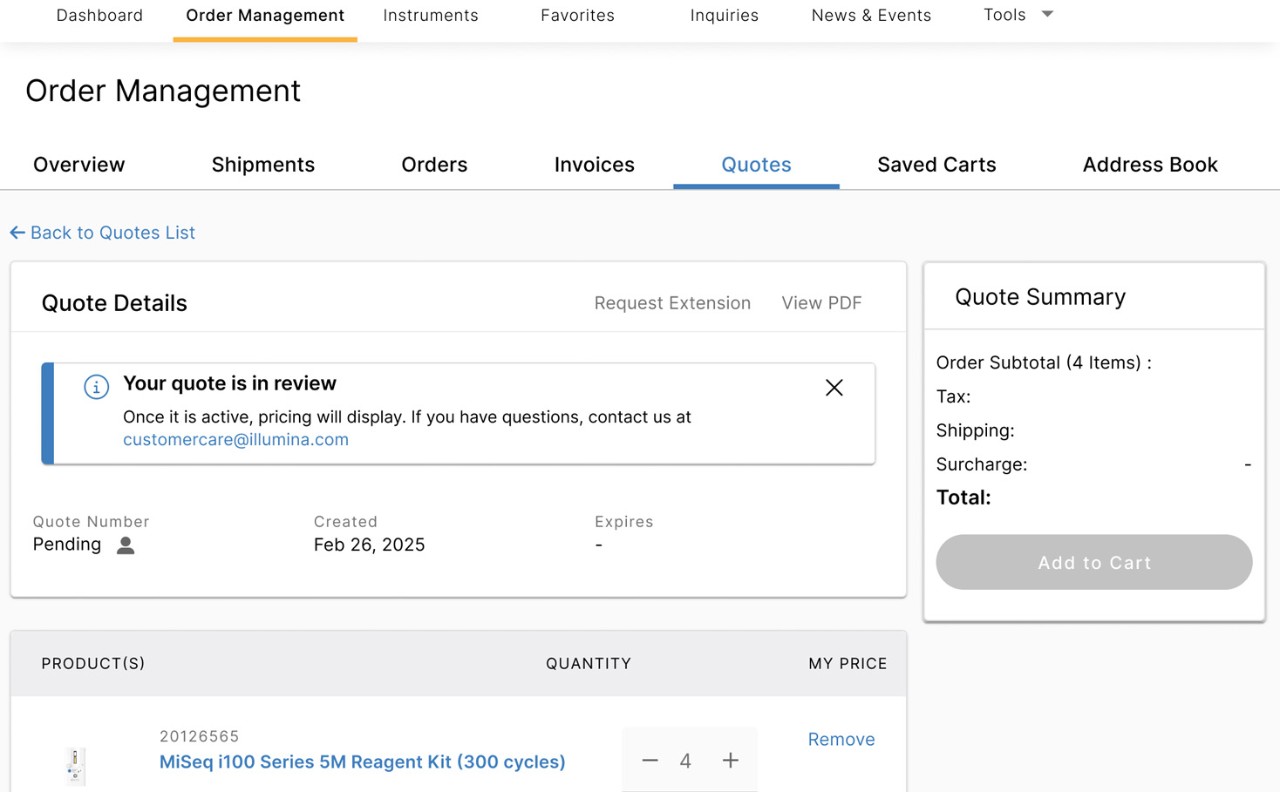
When your quote is ready, an alert will appear in the notification bell in MyIllumina. The status of your quote can also be viewed in near real-time in Order Management under Recent Quotes, making it easy to locate and manage quote status, expiration dates, amounts, and other quote information.
For additional assistance, contact our Customer Care team at customercare@Illumina.com.